Empirical Research · Inclusive Design · Interaction Technology
Empirical Research · Inclusive Design · Interaction Technology
What if the way people move together tells us more about autism than any checklist ever could? Sixty-eight participants, a motion capture lab, and an unexpected finding: autistic participants performed better and found it harder. Both at the same time.
Autism diagnosis has an average 11-year gap. Motor behaviour, which is central to how people interact, was barely being studied outside isolated lab tasks.
Autism diagnosis still relies heavily on structured observation, clinician interpretation, and checklists designed around a fairly narrow idea of what autism looks like. This is particularly true for women and gender-diverse individuals who mask their symptoms, who are most likely to be overlooked. The median diagnostic gap between a first evaluation and a formal diagnosis in adults is 11 years. Meanwhile, something more fundamental was going largely unmeasured: how people move together, synchronise, and recover from disruption. Motor behaviour is increasingly recognised as central to autism, not a side symptom. But most research used static, isolated tasks that strip away the dynamic quality of real interaction. I wanted to study something closer to what actually happens between people.
11 yrs
Median diagnostic gap
The average time between a first mental health evaluation and a formal autism diagnosis in adults, often longer for women.
45%
Misdiagnosis rate in women
Compared to 18% in men. Existing tools reflect a male-centric model of autism and are particularly blind to camouflaging.
68
Participants recruited
22 autistic, 46 non-autistic adults. 64% female. Ages 19 to 57. Recruited across the University of Twente and ASD community networks.
I built two experimental tasks from scratch, ran all 68 sessions entirely solo, and wrote a multi-step Python analysis pipeline covering everything from raw motion capture data to statistical output.
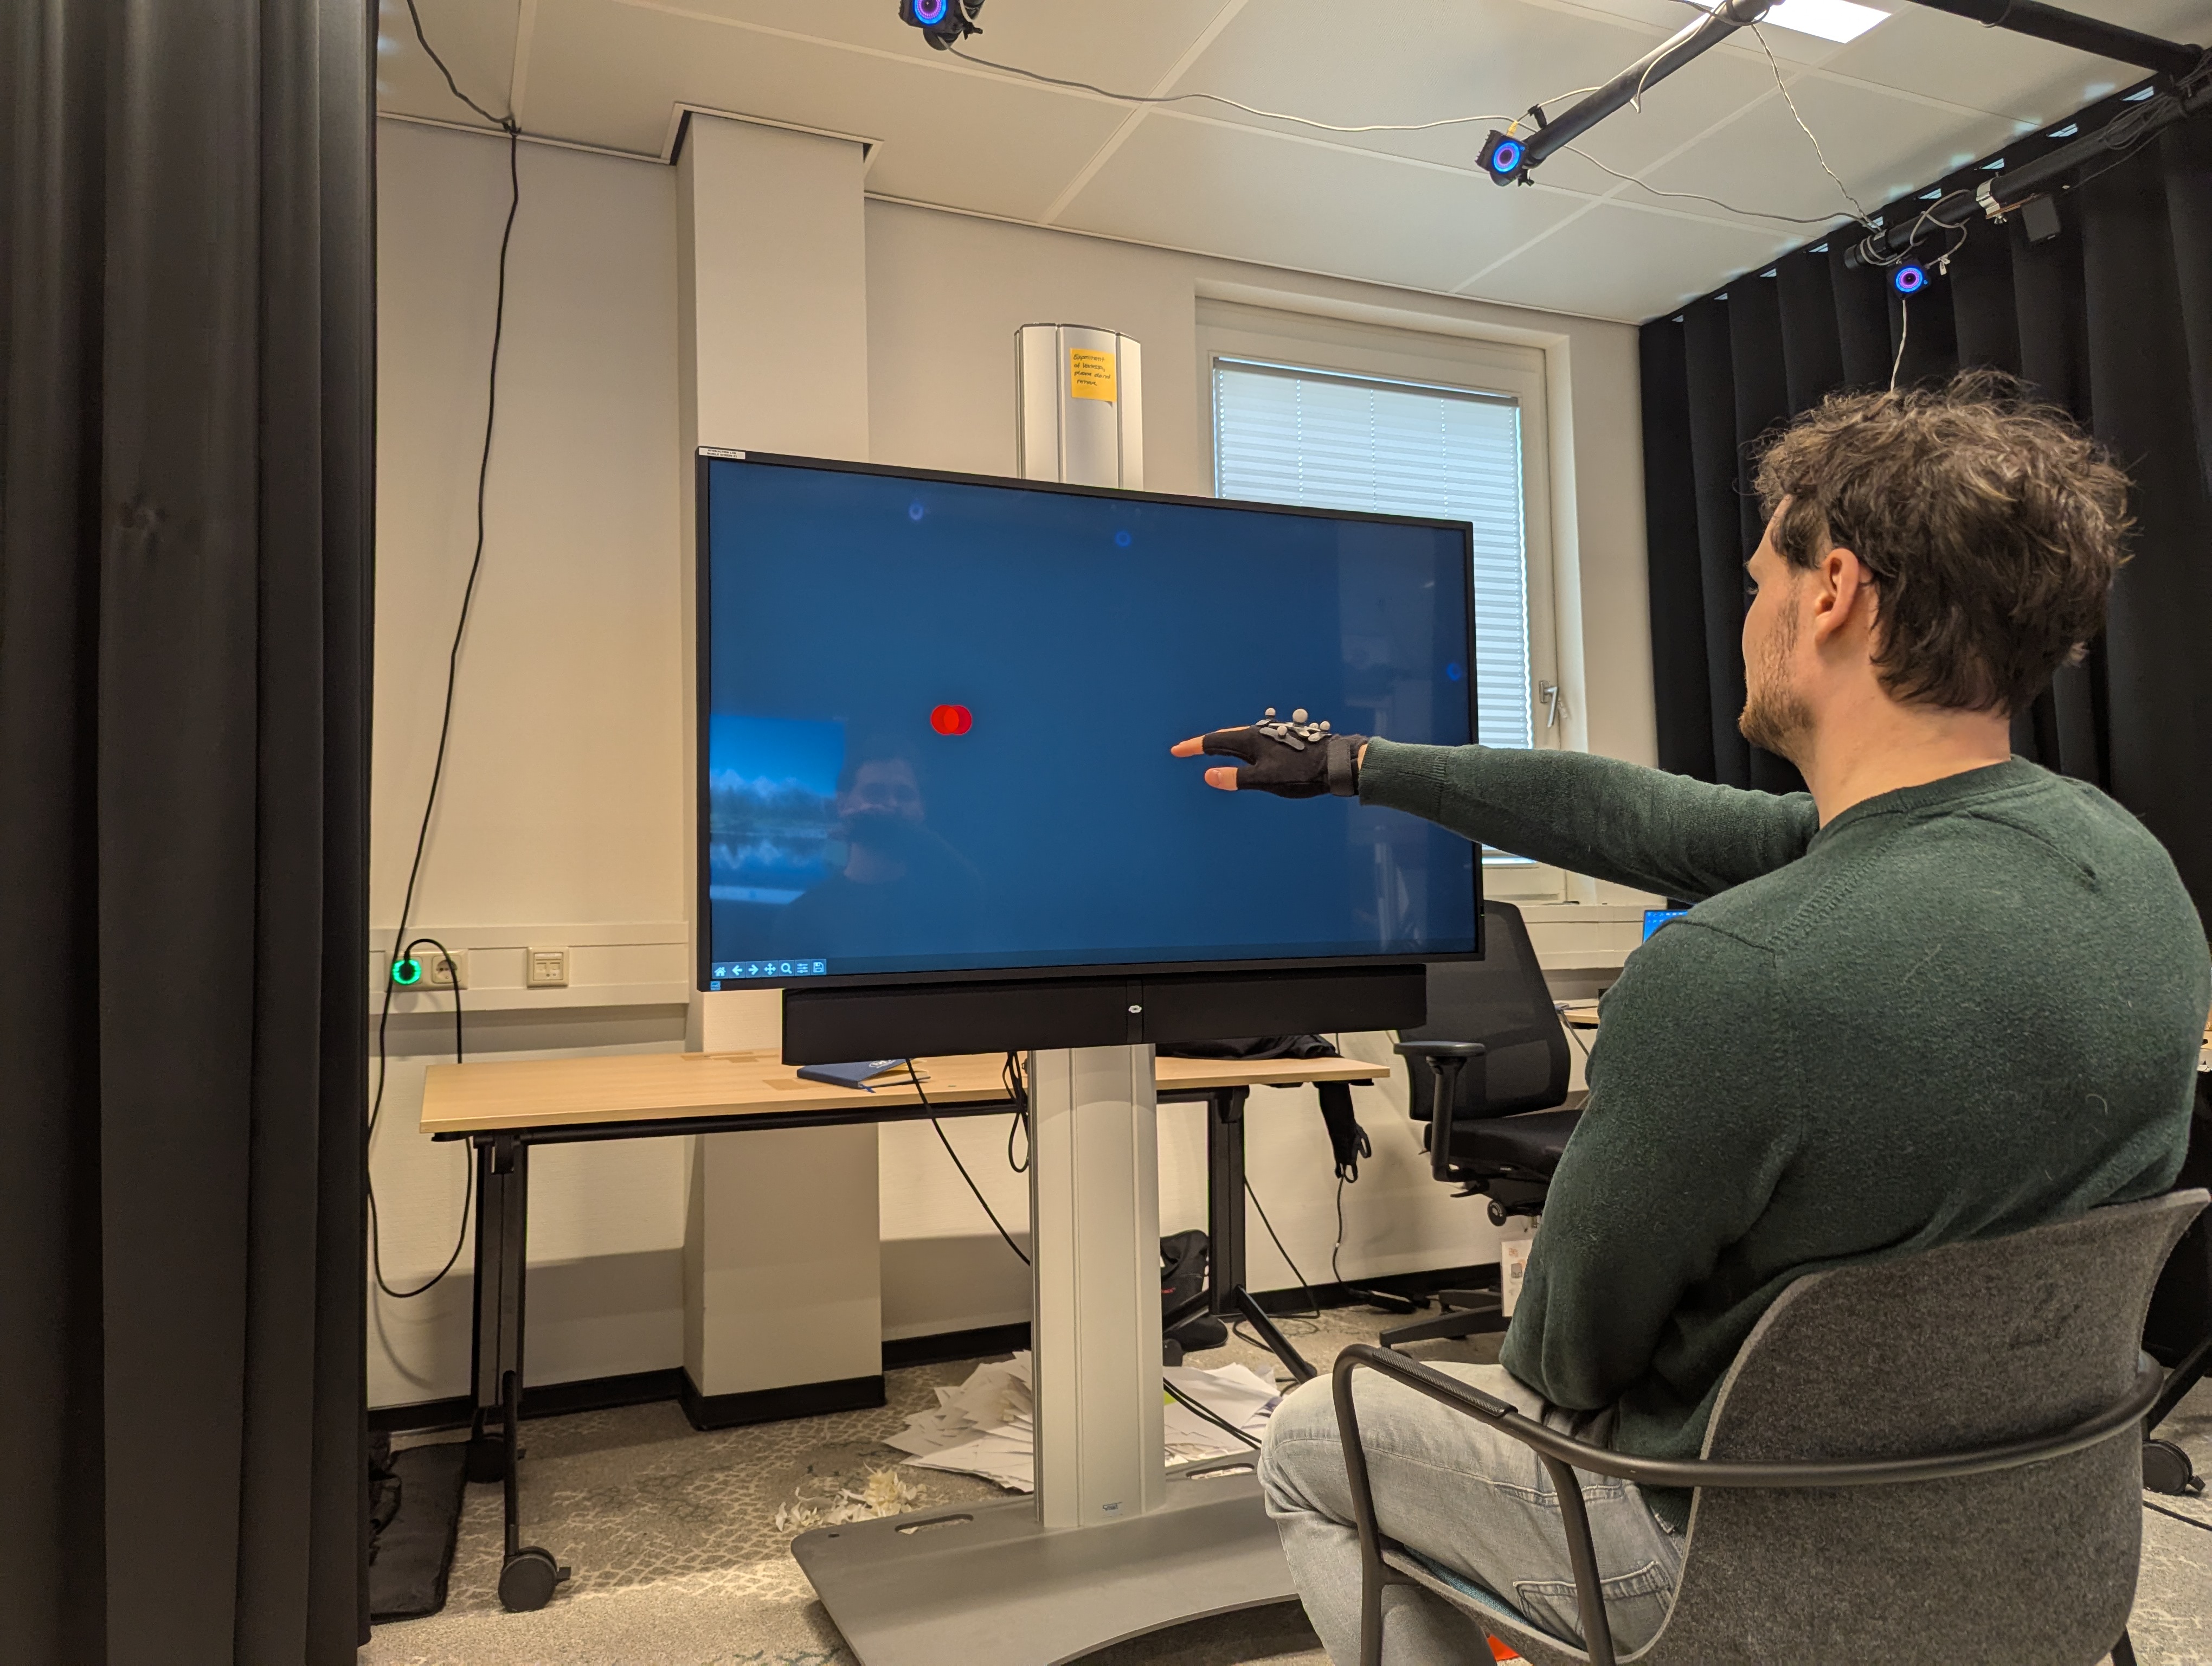
I designed and built two experimental tasks from scratch in the University of Twente's Interaction Lab, running every session entirely solo. Both adapted the Mirror Game paradigm, where two people move together and try to stay in sync, to generate precise quantifiable data on how synchrony breaks and recovers in real time.
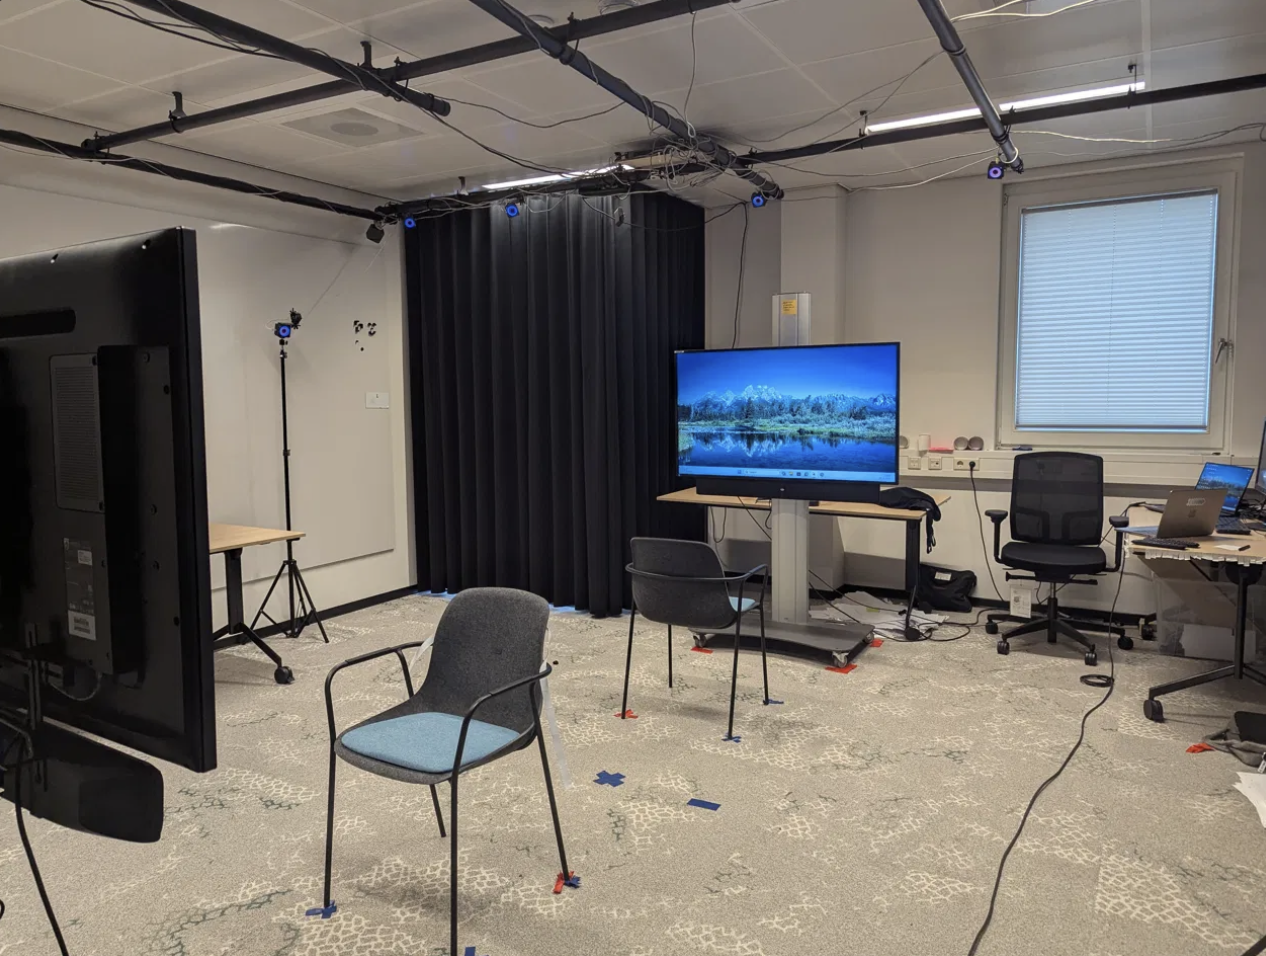
Sessions were designed to reduce sensory load from the start: a curtained lab space, minimal noise, instructions in English and Dutch, and individual accommodations arranged in advance. Inclusive research design shapes who shows up and what the data can actually say.
Task 1 was individual: participants used their dominant hand to follow a red ball oscillating on a screen. At unpredictable moments the ball jumped, disrupting coordination. The reference trajectory used my own hand movement recording, keeping the motion human and slightly irregular.
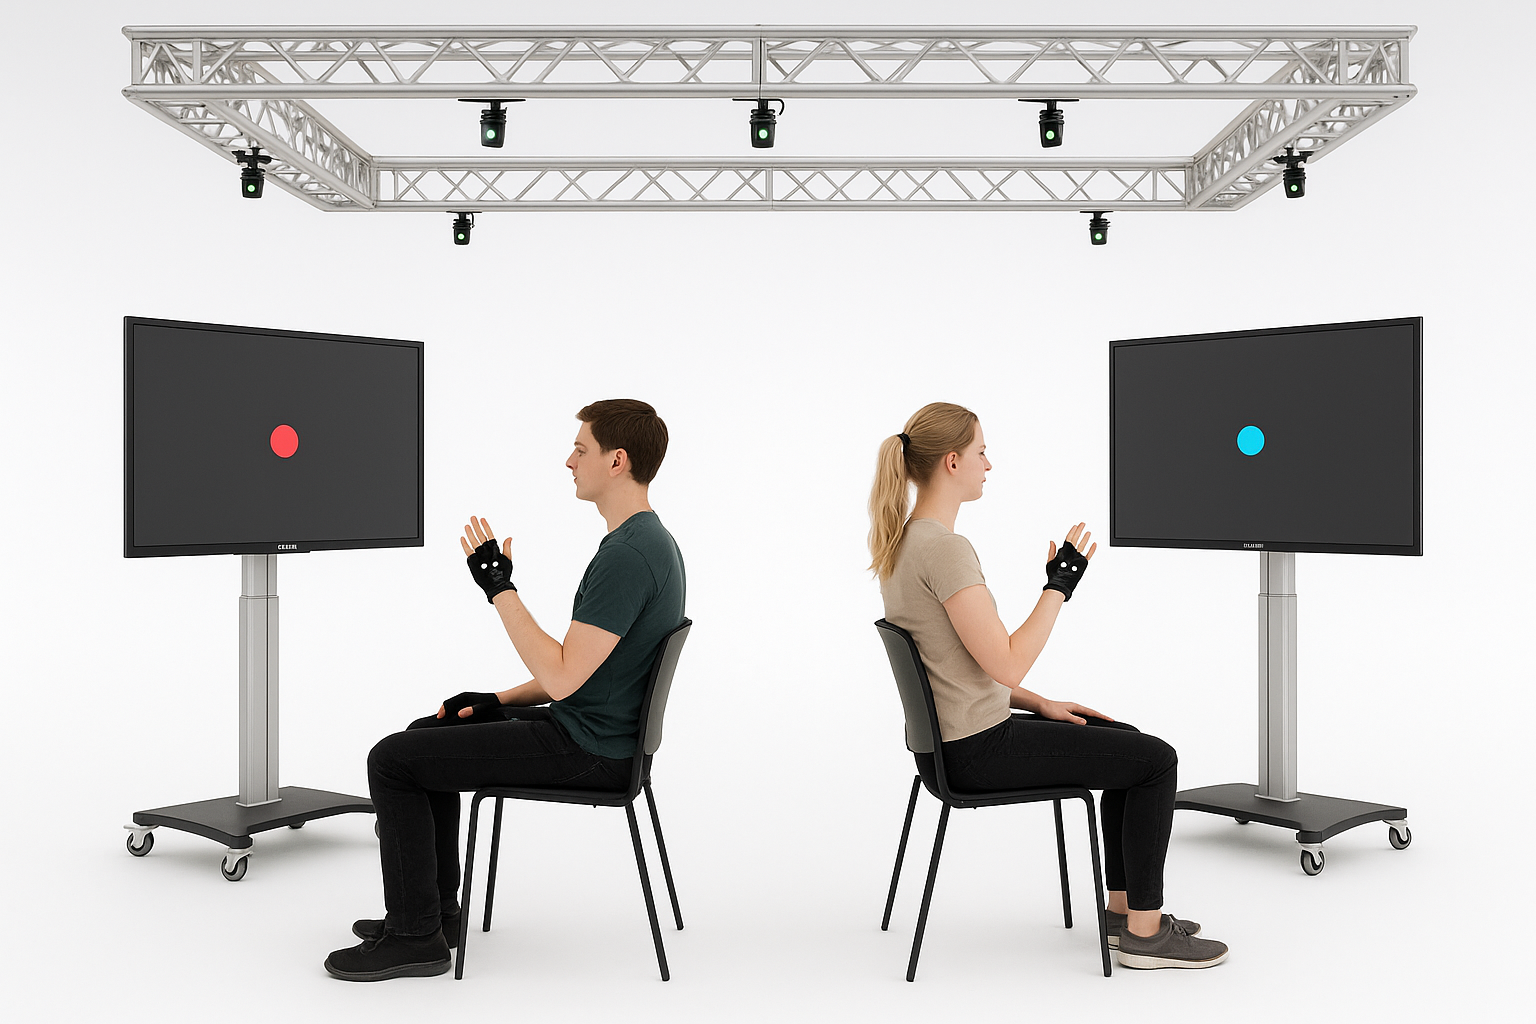
Task 2 was dyadic: two participants sat back to back, each controlling a ball on their own screen while trying to stay in sync. Periods of visual occlusion forced them to negotiate lead and follow.
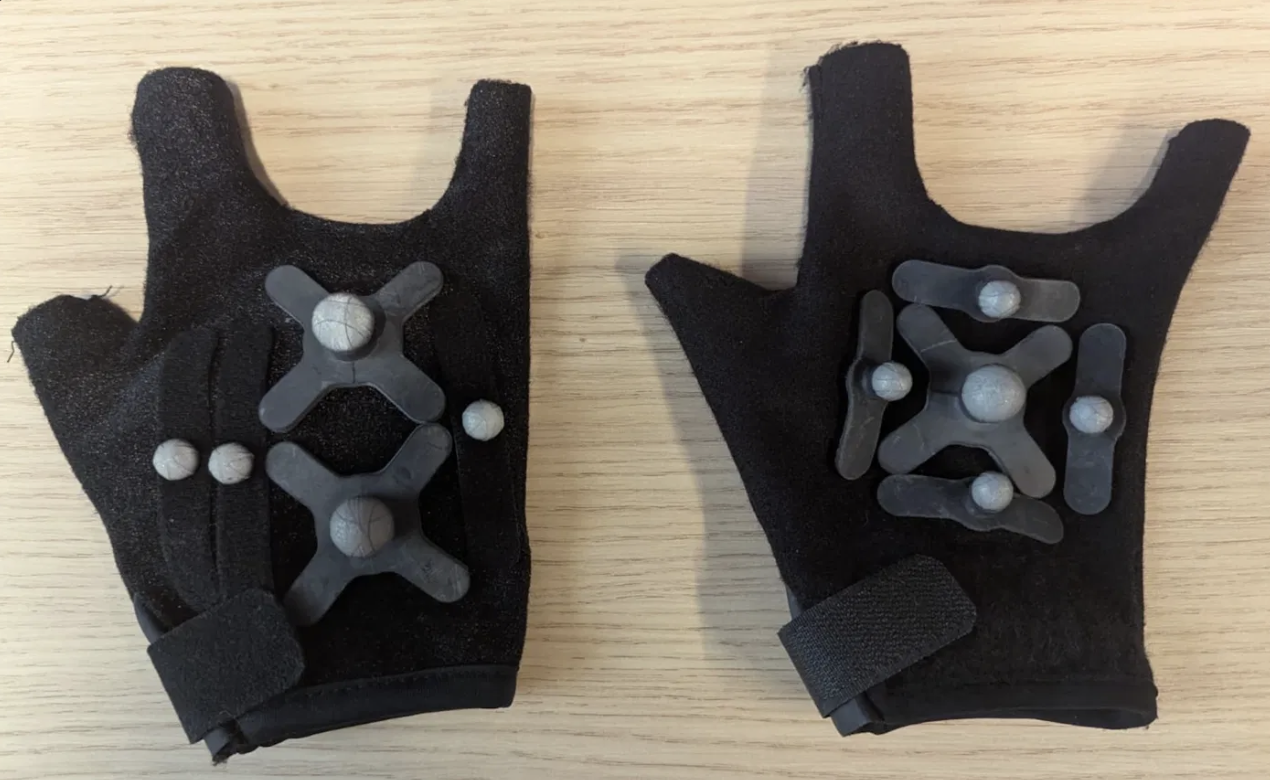
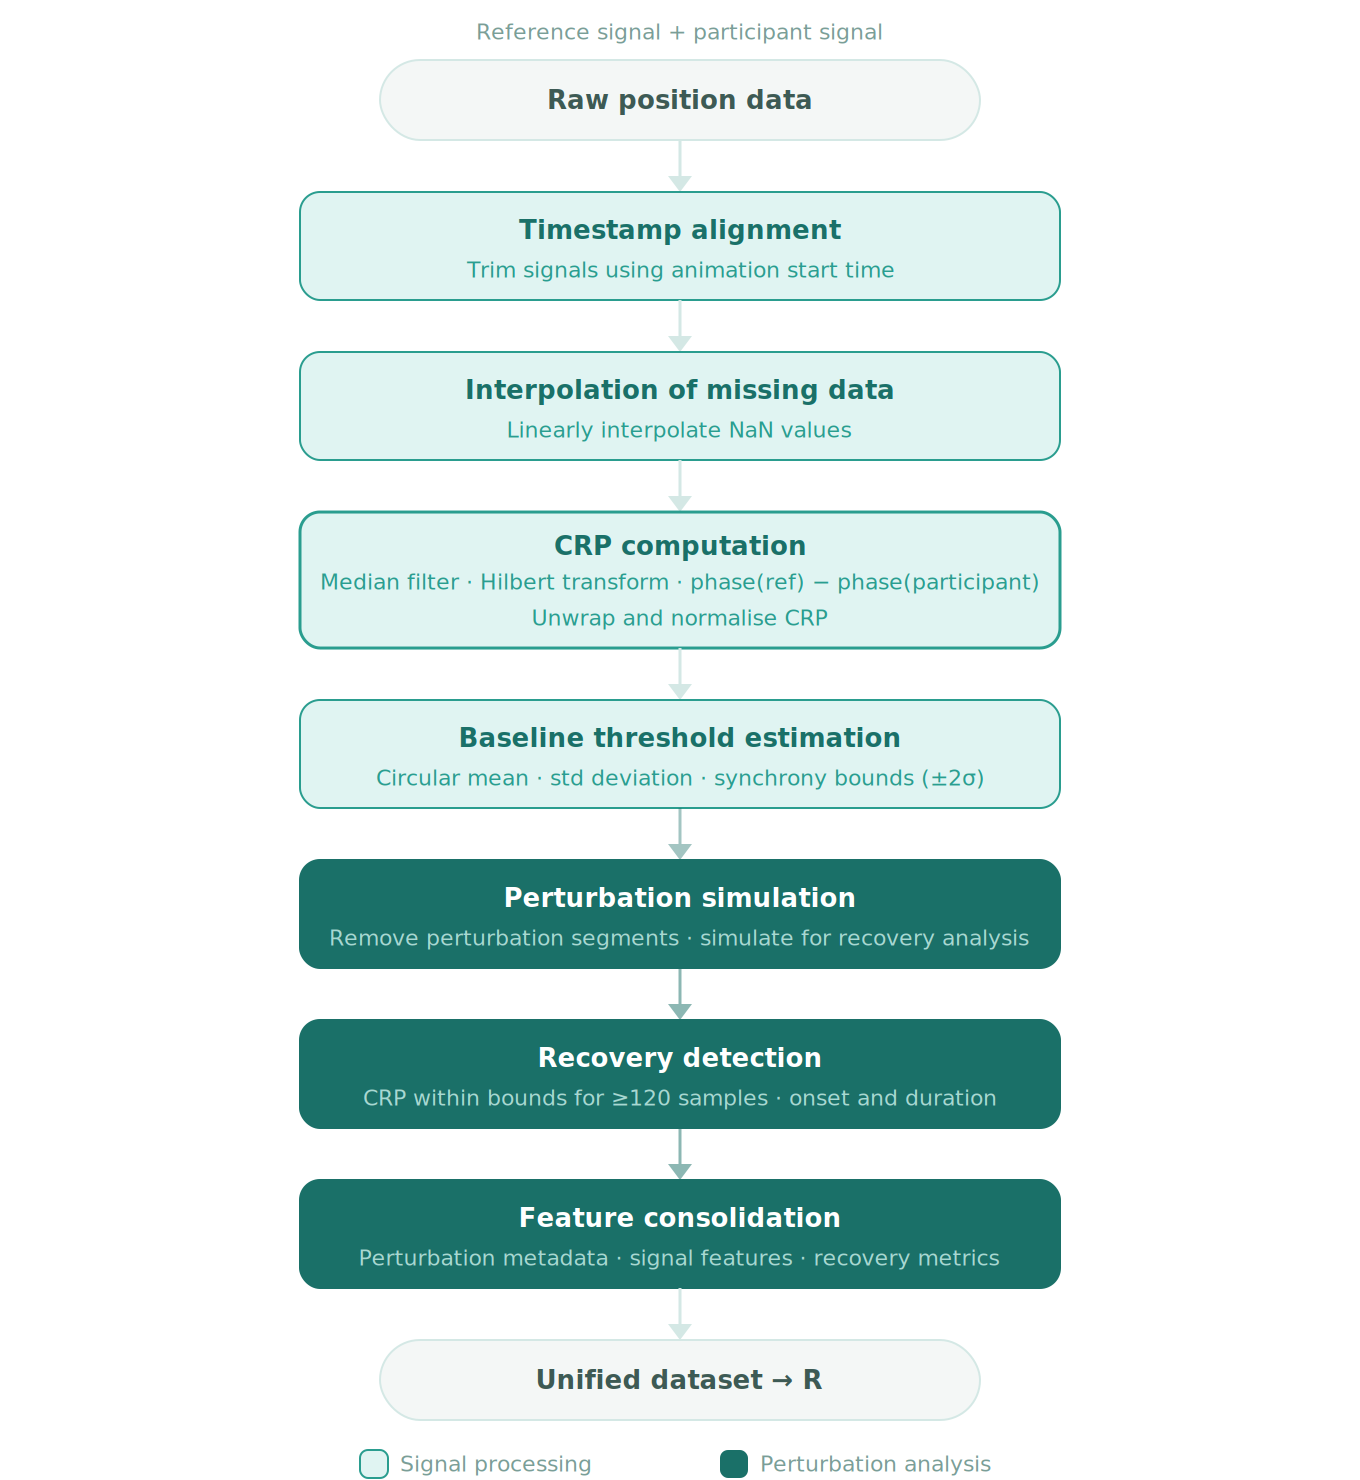
Motion data came from a 14-camera OptiTrack system at 240Hz. The analysis pipeline, written in Python, handled signal alignment, filtering, phase computation, and a custom recovery detection algorithm. Statistical models ran in R.
The pipeline handled: timestamp alignment between the animation system and motion capture, signal filtering, Hilbert-transform-based phase computation, and a custom recovery detection algorithm using Continuous Relative Phase (CRP). CRP quantifies the phase relationship between two motion signals over time, revealing not just whether people are in sync, but how their coordination evolves moment to moment. Statistical models used linear mixed-effects regression in R.
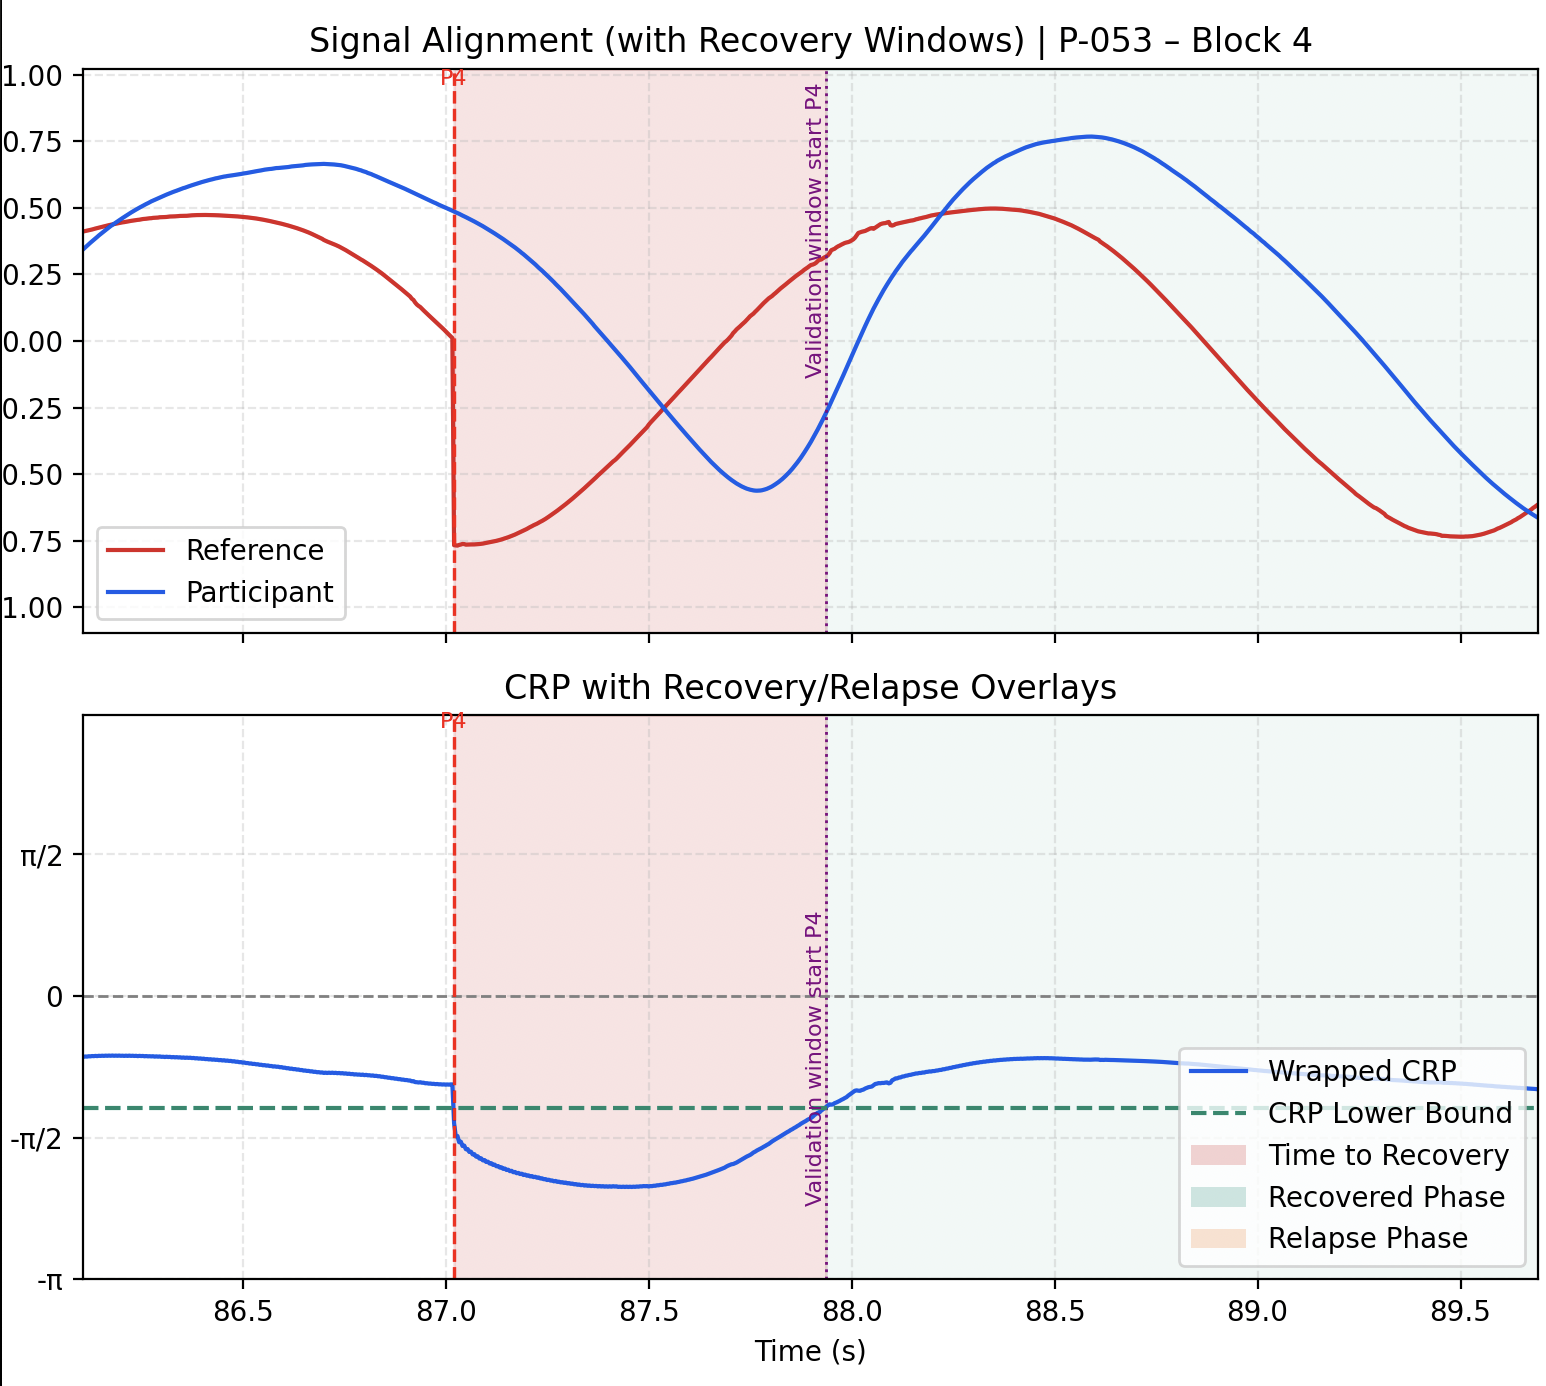
One perturbation event, one participant. The upper panel shows the position signals of the participant and the reference animation over time. The lower panel shows the CRP, which tracks how their coordination evolves moment to moment. When the red dashed line hits, coordination breaks. The red window is how long recovery takes. The green region is where coordination is re-established.
Each session ended with a short semi-structured interview combining Likert-scale ratings and open-ended questions about how participants experienced the task and handled disruptions.
Within the constraints of a master's thesis, I completed the full analysis for Task 1. Task 2 was implemented and documented in full, with its data now being picked up through my ongoing voluntary work with my former supervisor at the University of Twente.
The headline finding was the opposite of every hypothesis: autistic participants recovered from coordination disruptions around 100ms faster than non-autistic participants.
The headline finding was one I did not expect: autistic participants showed stronger baseline synchrony and recovered from perturbations faster than non-autistic participants, on average about 100ms quicker. Every one of my hypotheses had pointed the other way. The results were more interesting for it.
~100ms
Faster recovery
Autistic participants re-established synchrony with the reference signal faster after each perturbation. The difference was stable across the full experiment and not explained by sex or trial order.
Tighter
Stronger baseline synchrony
Before any perturbations, autistic participants were more closely and consistently aligned with the reference signal. Both the average phase alignment and its variability differed significantly between groups.
But harder
Higher perceived effort
Post-task interviews told a different story. Autistic participants rated the disruptions as significantly more challenging (p = .014), even though their motor recovery was faster. The difference was specific to the disruptions. General task difficulty showed no group difference at all. Performance and effort are not always the same thing.
Why?
A reactive control strategy
The structured, visually continuous task likely favoured locking onto the ball and correcting in real time. Non-autistic participants more often tried to anticipate the motion, a strategy that backfired when the ball jumped unexpectedly.
The post-task interviews captured the contrast directly:
"I did not really find any pattern, just moved my arm to the ball every time. I tried to use the ball as orientation point."
Autistic participant, P-001
"I tried to guess the pattern and assume the trajectory. I was able to catch up quickly based on those predictions."
Non-autistic participant, P-018
Three things this project reflects about how I work:
Research ownership
End to end, entirely solo
I designed both tasks, built the lab setup, recruited and ran all 68 sessions, wrote the full analysis pipeline in Python, and ran the statistical models in R. Every decision was mine to make and mine to defend, which also meant there was nowhere to hide when something did not work.
Methods
Knowing when numbers need words
The quantitative pipeline told me autistic participants recovered faster. The post-task interviews told me they found it harder. Neither alone was the full picture. Choosing to include both was not a requirement. It was the right call.
Rigour
Rigour means following the data, not your hypothesis
My hypotheses predicted reduced performance in the autistic group. The data went the other way, consistently. Sitting with that, tracing why, and letting it reframe the whole interpretation made the thesis considerably more interesting, and more honest.